
what is normality in the regression, some sample from stata
Posted by: admin 1 year, 3 months ago
(Comments)
What is normality in regression?
Normality means that the residual in regression is distributed normally, meaning that there is a huge amount of data in the middle and a couple of tails on both the left and right.
Many researchers believe that multiple regression requires normality. This is not the case. Normality of residuals is only required for valid hypothesis testing; that is, the normality assumption assures that the p-values for the t-tests and F-test will be valid. Normality is not required to obtain unbiased estimates of the regression coefficients. OLS regression merely requires that the residuals (errors) be identically and independently distributed.
Furthermore, there is no assumption or requirement that the predictor variables be normally distributed. If this were the case, then we would not be able to use dummy-coded variables in our models.
After we run a regression analysis, we can use the predict command to create residuals and then use commands such as kdensity, qnorm and pnorm to check the normality of the residuals.
Let’s use the elemapi2 data file we saw in Chapter 1 for these analyses. Let’s predict academic performance (api00) from the percent receiving free meals (meals), percent of English language learners (ell), and percent of teachers with emergency credentials (emer).
use https://stats.idre.ucla.edu/stat/stata/webbooks/reg/elemapi2
regress api00 meals ell emer

  Source |       SS       df       MS                  Number of obs =     400
---------+------------------------------               F(  3,   396) =  673.00
   Model |  6749782.75     3  2249927.58               Prob > F      =  0.0000
Residual |  1323889.25   396  3343.15467               R-squared     =  0.8360
---------+------------------------------               Adj R-squared =  0.8348
   Total |  8073672.00   399  20234.7669               Root MSE      =   57.82

------------------------------------------------------------------------------
   api00 |      Coef.   Std. Err.       t     P>|t|       [95% Conf. Interval]
---------+--------------------------------------------------------------------
   meals |  -3.159189   .1497371    -21.098   0.000      -3.453568   -2.864809
     ell |  -.9098732   .1846442     -4.928   0.000      -1.272878   -.5468678
    emer |  -1.573496    .293112     -5.368   0.000      -2.149746   -.9972456
   _cons |   886.7033    6.25976    141.651   0.000       874.3967    899.0098
------------------------------------------------------------------------------
We then use the predict command to generate residuals.
predict r, resid
Below we use the kdensity command to produce a kernel density plot with the normal option requesting that a normal density be overlaid on the plot. kdensity stands for kernel density estimate. It can be considered a histogram with narrow bins and a moving average.
kdensity r, normal
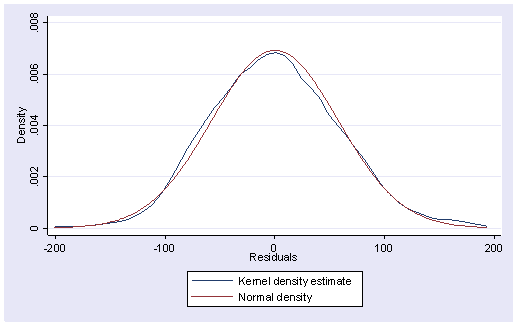
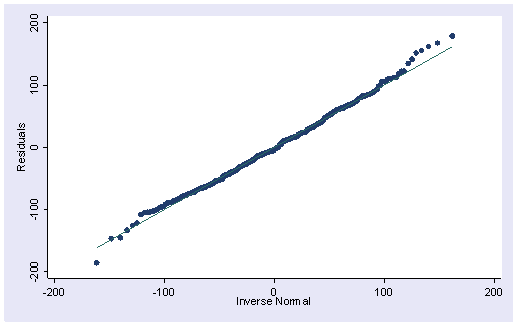
The pnorm command graphs a standardized normal probability (P-P) plot while qnorm plots the quantiles of a variable against the quantiles of a normal distribution. pnorm is sensitive to non-normality in the middle range of data and qnorm is sensitive to non-normality near the tails. As you see below, the results from pnorm show no indications of non-normality, while the qnorm command shows a slight deviation from normal at the upper tail, as can be seen in the kdensity above. Nevertheless, this seems to be a minor and trivial deviation from normality. We can accept that the residuals are close to a normal distribution.
pnorm rqnorm r
There are also numerical tests for testing normality. One of the tests is written by Lawrence C. Hamilton, Dept. of Sociology, Univ. of New Hampshire, called iqr. You can get this program from Stata by typing search iqr (see How I can used the search command to search for programs and get additional help? for more information about using search).
iqr stands for inter-quartile range and assumes the symmetry of the distribution. Severe outliers consist of those points that are either 3 inter-quartile ranges below the first quartile or 3 inter-quartile ranges above the third quartile. Any severe outliers should be sufficient evidence to reject normality at a 5% significance level. Mild outliers are common in samples of any size. In our case, we don’t have any severe outliers, and the distribution seems pretty symmetric. The residuals have an approximately normal distribution.
iqr r

   mean=  7.4e-08         std.dev.=   57.6          (n= 400)
 median= -3.657    pseudo std.dev.=  56.69        (IQR=  76.47)
10 trim= -1.083
                                               low         high
                                               -------------------
                                inner fences   -154.7       151.2
                           # mild outliers     1           5
                           % mild outliers     0.25%       1.25%

                                outer fences   -269.4       265.9
                           # severe outliers   0           0
                           % severe outliers   0.00%       0.00%
Another test available is the swilk test which performs the Shapiro-Wilk W test for normality. The p-value is based on the assumption that the distribution is normal. In our example, it is very large (.51), indicating that we cannot reject that r is normally distributed.
swilk r

                   Shapiro-Wilk W test for normal data
 Variable |    Obs           W         V          z   Pr > z
 ---------+-------------------------------------------------
        r |    400     0.99641     0.989     -0.025  0.51006
Share on Twitter
Share on Facebook


3 months, 3 weeks ago
A reflection of using kanban flow and being minimalist
Recent newsToday is the consecutive day I want to use and be consistent with the Kanban flow! It seems it's perfect to limit my parallel and easily distractedness.
read more4 months ago
4 months ago
Podcast Bapak Dimas 2 - pindahan rumah
Recent newsVlog kali ini adalah terkait pindahan rumah!
read more4 months ago
Podcast Bapak Dimas - Bapaknya Jozio dan Kaziu - ep 1
Recent newsSeperti yang saya cerita kan sebelumnya, berikut adalah catatan pribadi VLOG kita! Bapak Dimas
read more4 months ago
Happy new year 2024 and thank you 2023!
Recent newsAs the new year starts, I want to revisit what has happened in 2023.
read more4 months, 1 week ago
Some notes about python and Zen of Python
Recent newsExplore Python syntax
Python is a flexible programming language used in a wide range of fields, including software development, machine learning, and data analysis. Python is one of the most popular programming languages for data professionals, so getting familiar with its fundamental syntax and semantics will be useful for your future career. In this reading, you will learn about Python’s syntax and semantics, as well as where to find resources to further your learning.
5 months, 2 weeks ago

Collaboratively administrate empowered markets via plug-and-play networks. Dynamically procrastinate B2C users after installed base benefits. Dramatically visualize customer directed convergence without
Comments