PhD Chapter - from A to Z in importing the data from XLS
Posted by: admin 3 years, 1 month ago
(Comments)

So a couple of question that comes up when we want to deal with the data is how to read and deal with them.
So I will take the example on how to read it, how to filter them, and how to clean from Nan.
1. How to locate your file
2. How to import in the shape that we want.
3. The logic behind naming every row or column as the header
4. Use this data and be ready for any statistic that we want.
How to locate your file.
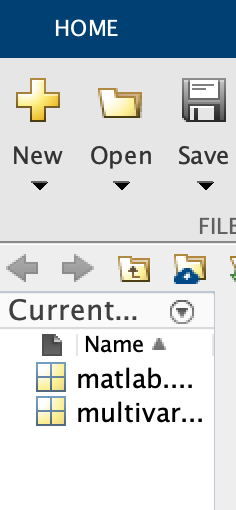
1. It's pretty simple actually. Just click on the current matlab directory that you have. The place is in the left panel of Matlab
 There you can directly type the function to read the xls.
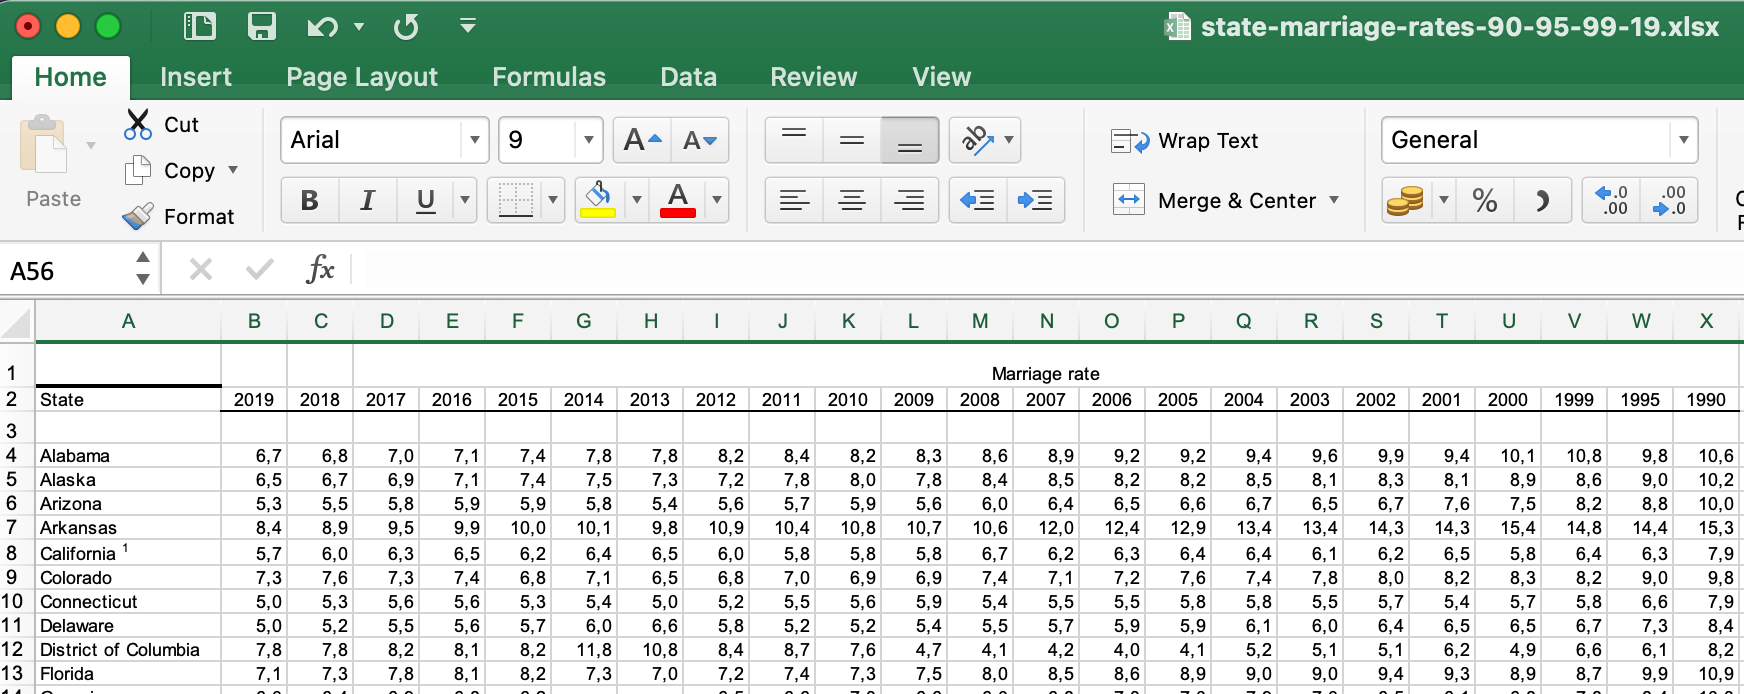
And here is my data look like.

You can download the data from this link.
%1. First is clean all the data
% a clear MATLAB workspace is a clear mental workspace
close all; clear; clc

%2. Import with xls read
[num,txt,raw]= xlsread("state-marriage.xlsx")
data = raw;
%3. check sizes and outputs
whos

%4. Make the matrix from the data
% initialize matrices
%M is the matrix where there is 51 row with 23 column
M = zeros(51,23);
%statesM is creating the cell with 51 row and 1 column
statesM = cell(51,1);
%the year is creating 23 row with one column
yearM = zeros(23,1);

% 5. import the data; start with a loop over columns
% for the column i from 1 until 23
for coli = 1:length(yearM)

 % get year (same for all rows...)
 % some columns are text, others are numeric
 % the symbol { meaning the new row
 yearval = data{2,coli+1};
 if isnumeric(yearval)
 yearM(coli) = yearval;
 else
 yearM(coli) = str2double(yearval);
 end


 % loop over rows
 for rowi = 1:51

 % get value from this cell and convert to number
 val = data{rowi+3,coli+1};
 if isnumeric(val)
 M(rowi,coli) = val;
 else
 M(rowi,coli) = str2double(val);
 end


 % get state label (only in first colum)
 if coli==1
 statesM{rowi} = data{rowi+3,1};
 end
 end % end row loop
end % end column loop

%% 6. Check if the data clean the marriage data

figure(1), clf
imagesc(yearM,[],M)
colorbar
set(gca,'clim',[0 10])
xlabel('Year'), ylabel('State')

% 7. Replace the Nan with something, for example median or zero
% replace with column zero
[nanrow,nancol] = find(isnan(M));
for i=1:length(nanrow)
 M(nanrow(i),nancol(i)) = nanmedian(M(:,nancol(i)));
end

% And thats all
So that's all now the way to import excel file! Hopefully it helps!
Kenapa sekolah PhD butuh waktu lama!?
Recent newsKali ini kita akan bahas kenapa sekolah PhD itu lama! Tanpa panjang lebar, berikut cara ngeles gw! Maksudnya berikut alasannya! Hope its relate with you!
read more3 days, 16 hours ago
Using Vertex AI for zero one and two three AI prediction
Recent newsHere is my documentation after learning the introduction of AI in courserERA.
read more2 weeks, 6 days ago
Neural network with API for pre-trained API
Recent newsOverview
The Cloud Natural Language API lets you extract entities from text, perform sentiment and syntactic analysis, and classify text into categories.
read more3 weeks, 1 day ago
what is null result
Recent newsNull result in economic is when the output does not supporting your hypothesis
read more3 weeks, 3 days ago
3 weeks, 3 days ago
Fixing the issue in assumption of OLS step by step or one by one
Recent newsHi, I want to raise the issue related to know whether your OLS is ok or not.
read more1 month, 2 weeks ago
Meaning of 45 degree in economics chart
Recent newsThe **45-degree line** in economics and geometry refers to a line where the values on the x-axis and y-axis are equal at every point. It typically has a slope of 1, meaning that for every unit increase along the horizontal axis (x), there is an equal unit increase along the vertical axis (y). Here are a couple of contexts where the 45-degree line is significant:
read more2 months, 3 weeks ago

Collaboratively administrate empowered markets via plug-and-play networks. Dynamically procrastinate B2C users after installed base benefits. Dramatically visualize customer directed convergence without


Comments