Using Vertex AI for zero one and two three AI prediction
Recent newsHere is my documentation after learning the introduction of AI in courserERA.
read more(Comments)
After I have finished my PhD, I think I really know who I would like to become, and I am taking my interest in the solution architect for a large IT infrastructure. It is very interesting work that requires thinking on a big scale, as it is very related to my thesis topic, the systemic wide supervision of financial systems. To learn that, let's get our hands dirty by analyzing the first example of how to create a training model and run it.
The Welcome to BigQuery message box opens in the Cloud Console. This message box provides a link to the quickstart guide and lists UI updates.
The Create dataset dialog opens.
bqml_lab
for Dataset ID, and click on CREATE DATASET (accepting the other default values).The data we will use in this lab sits in the bigquery-public-data project, that is available to all. Let's take a look at a sample of this data.
#standardSQL
SELECT
IF(totals.transactions IS NULL, 0, 1) AS label,
IFNULL(device.operatingSystem, "") AS os,
device.isMobile AS is_mobile,
IFNULL(geoNetwork.country, "") AS country,
IFNULL(totals.pageviews, 0) AS pageviews
FROM
`bigquery-public-data.google_analytics_sample.ga_sessions_*`
WHERE
_TABLE_SUFFIX BETWEEN '20160801' AND '20170631'
LIMIT 10000;
The data tables have a lot of columns, but there are few of interest to us that we will use to create our ML model. Here the visitor's device's operating system is used, whether said device is a mobile device, the visitor's country or region and the number of page views will be used as the criteria for whether a transaction has been made. In this case, label
is what you're trying to fit to (or predict).
This data will be the training data for the ML model you create. The training data is being limited to those collected from 1 August 2016 to 31 June 2017. This is done to save the last month of data for "prediction". It is further limited to 10,000 data points to save some time.
bqml_lab
and type training_data
as the Table Name and click Save.#standardSQL
CREATE OR REPLACE MODEL `bqml_lab.sample_model`
OPTIONS(model_type='logistic_reg') AS
SELECT * from `bqml_lab.training_data`;
In this case, bqml_lab
is the name of the dataset, sample_model
is the name of the model, training_data
is the transactions data we looked at in the previous task. The model type specified is binary logistic regression.
Running the CREATE MODEL
command creates a Query Job that will run asynchronously so you can, for example, close or refresh the BigQuery UI window.
If interested, you can get information about the model by clicking on bqml_lab
dataset on the left-hand menu and then click the sample_model
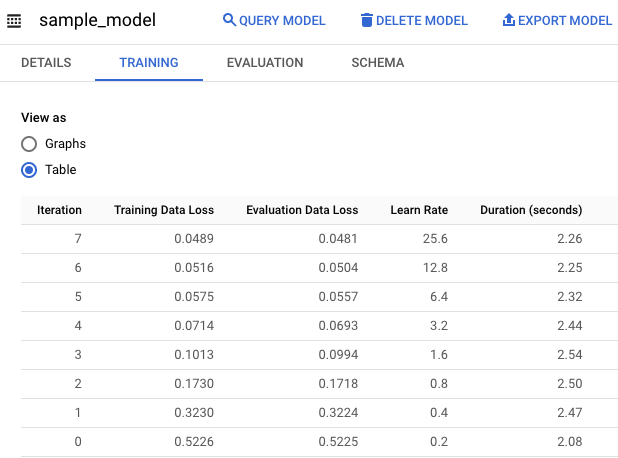
dataset in the UI. Under Details, you should find some basic model info and training options used to produce the model. Under Training, you should see a table similar to this:
#standardSQL
SELECT
*
FROM
ml.EVALUATE(MODEL `bqml_lab.sample_model`);
In this query, you use the ml.EVALUATE
function to evaluate the predicted values against the actual data, and it shares some metrics of how the model performed. You should see a table similar to this:
#standardSQL
SELECT
IF(totals.transactions IS NULL, 0, 1) AS label,
IFNULL(device.operatingSystem, "") AS os,
device.isMobile AS is_mobile,
IFNULL(geoNetwork.country, "") AS country,
IFNULL(totals.pageviews, 0) AS pageviews,
fullVisitorId
FROM
`bigquery-public-data.google_analytics_sample.ga_sessions_*`
WHERE
_TABLE_SUFFIX BETWEEN '20170701' AND '20170801';
You'll realize the SELECT
and FROM
portions of the query is similar to that used to generate training data. There is the additional fullVisitorId column which you will use for predicting transactions by individual user.The WHERE
portion reflects the change in time frame (July 1 to August 1 2017).
Let's save this July data so we can use it in the next 2 steps to make predictions using our model. Click on the Save and then select Save view from the dropdown to save this query as a view. In the popup, select Dataset as bqml_lab
and type july_data
as the Table Name and click Save.
Predict purchases per country/region
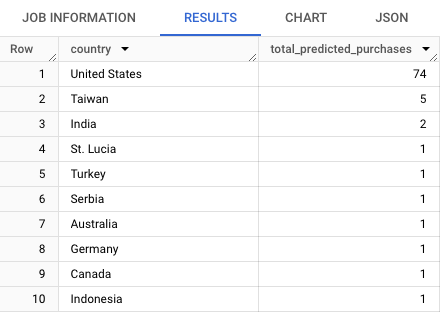
With this query you will try to predict the number of transactions made by visitors of each country or region, sort the results, and select the top 10 by purchases:
#standardSQL
SELECT
country,
SUM(predicted_label) as total_predicted_purchases
FROM
ml.PREDICT(MODEL `bqml_lab.sample_model`, (
SELECT * FROM `bqml_lab.july_data`))
GROUP BY country
ORDER BY total_predicted_purchases DESC
LIMIT 10;
In this query, you're using ml.PREDICT
and the BigQuery ML portion of the query is wrapped with standard SQL commands. For this lab you''re interested in the country and the sum of purchases for each country, so that's why SELECT
, GROUP BY
and ORDER BY
. LIMIT
is used to ensure you only get the top 10 results.
You should see a table similar to this:
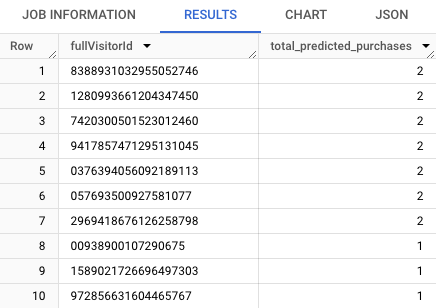
Here is another example. This time you will try to predict the number of transactions each visitor makes, sort the results, and select the top 10 visitors by transactions:
#standardSQL
SELECT
fullVisitorId,
SUM(predicted_label) as total_predicted_purchases
FROM
ml.PREDICT(MODEL `bqml_lab.sample_model`, (
SELECT * FROM `bqml_lab.july_data`))
GROUP BY fullVisitorId
ORDER BY total_predicted_purchases DESC
LIMIT 10;
You should see a table similar to this:
Here is my documentation after learning the introduction of AI in courserERA.
read moreThe Cloud Natural Language API lets you extract entities from text, perform sentiment and syntactic analysis, and classify text into categories.
read moreNull result in economic is when the output does not supporting your hypothesis
read moreHi, I want to raise the issue related to know whether your OLS is ok or not.
read moreThe **45-degree line** in economics and geometry refers to a line where the values on the x-axis and y-axis are equal at every point. It typically has a slope of 1, meaning that for every unit increase along the horizontal axis (x), there is an equal unit increase along the vertical axis (y). Here are a couple of contexts where the 45-degree line is significant:
read moreThe **hyperinflation in Hungary** in the aftermath of World War II (1945–1946) is considered the worst case of hyperinflation in recorded history. The reasons behind this extreme economic event are numerous, involving a combination of war-related devastation, political instability, massive fiscal imbalances, and mismanagement of monetary policy. Here's an in-depth look at the primary causes:
read more**Neutrality of money** is a concept in economics that suggests changes in the **money supply** only affect **nominal variables** (like prices, wages, and exchange rates) and have **no effect on real variables** (like real GDP, employment, or real consumption) in the **long run**.
read moreCollaboratively administrate empowered markets via plug-and-play networks. Dynamically procrastinate B2C users after installed base benefits. Dramatically visualize customer directed convergence without
Comments